Categories
Cacti Mitel Sys Admin

Mitel Bandwidth Management Graphs for Cacti

When running a cluster of Mitel PABX’s it is likely that you will have them interconnecting in one way or another. If you send calls over your WAN connection then these graphs are for you.

There are two graphs added:

Bandwidth – Shows the current set bandwidth limit and usage figures for a Zone Access Point
Calls – Shows the number of calls both accepted or rejected by Bandwidth Management
Categories
Cacti Linux Sys Admin

Monitoring Linux Disk Statistics with Cacti

I firstly want to acknowledge the work of Mark Round and Linux iostat monitoring with Cacti. The following work was inspired and based on the ideas found in Mark’s post.

My main objective when I started looking into disk monitoring was to get some similar stats into Cacti for Linux that can be found with the Windows PerfMon utility. I found Mark’s post and didn’t quite like the way it used cron to collect its statistics, and wanted something that I could easily add to snmpd.conf without needing to change much more. I was also keen on obtaining the mount point data for each partition as looking at “cciss/c0d0p3” doesn’t mean as much to management (and sometimes to me) and hopefully “/home” does.

Categories
Cacti Linux Sys Admin VMWare

Monitoring VMWare’s Free ESXi 3.5 with Cacti

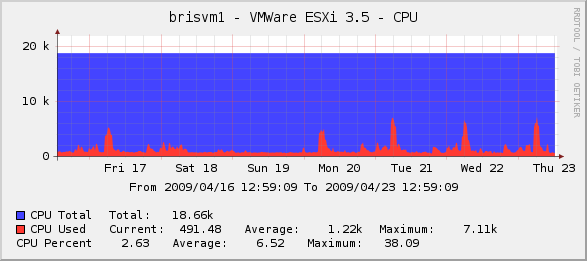
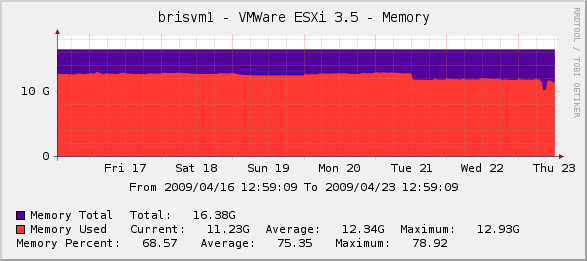
When I realised that the free version of VMWare ESXi only kept an hours worth of logging information I went looking for a solution to keep more statistical data. This is what I have come up with so far.

VMWare ESXi 3.5 CPU Graph in Cacti
VMWare ESXi 3.5 Memory Graph in Cacti